Weird Polar Equation Graphs

Boys, set your calculator to polar mode, and draw a graph of
$r=4sin(3θ)$, then set the first interval of [0,π] and the second one: [0, 2π]
[0,π] [0,2π]![[0,π]](/wp-content/uploads/2019/05/20190504_214003.webp)
![[0,2π]](/wp-content/uploads/2019/05/20190504_214019.webp)
They looks exactly the same, isn’t it?
And if we take of the integral of these two to find the area, for the graph with interval [0,π], area = 4π, but for the graph with [0,2π] the area is 8π, thus, which one is the “true” one we want to find?
I. The Form of Trig Polar Equation
For a trig polar equation, the form is looks like: r=asin(bθ) or cos etc…
a decide the “size of the graph”
b decide the number of “blades”
II. Odd number b and Even number b
The thing is vital :
*The number of blades = 2b
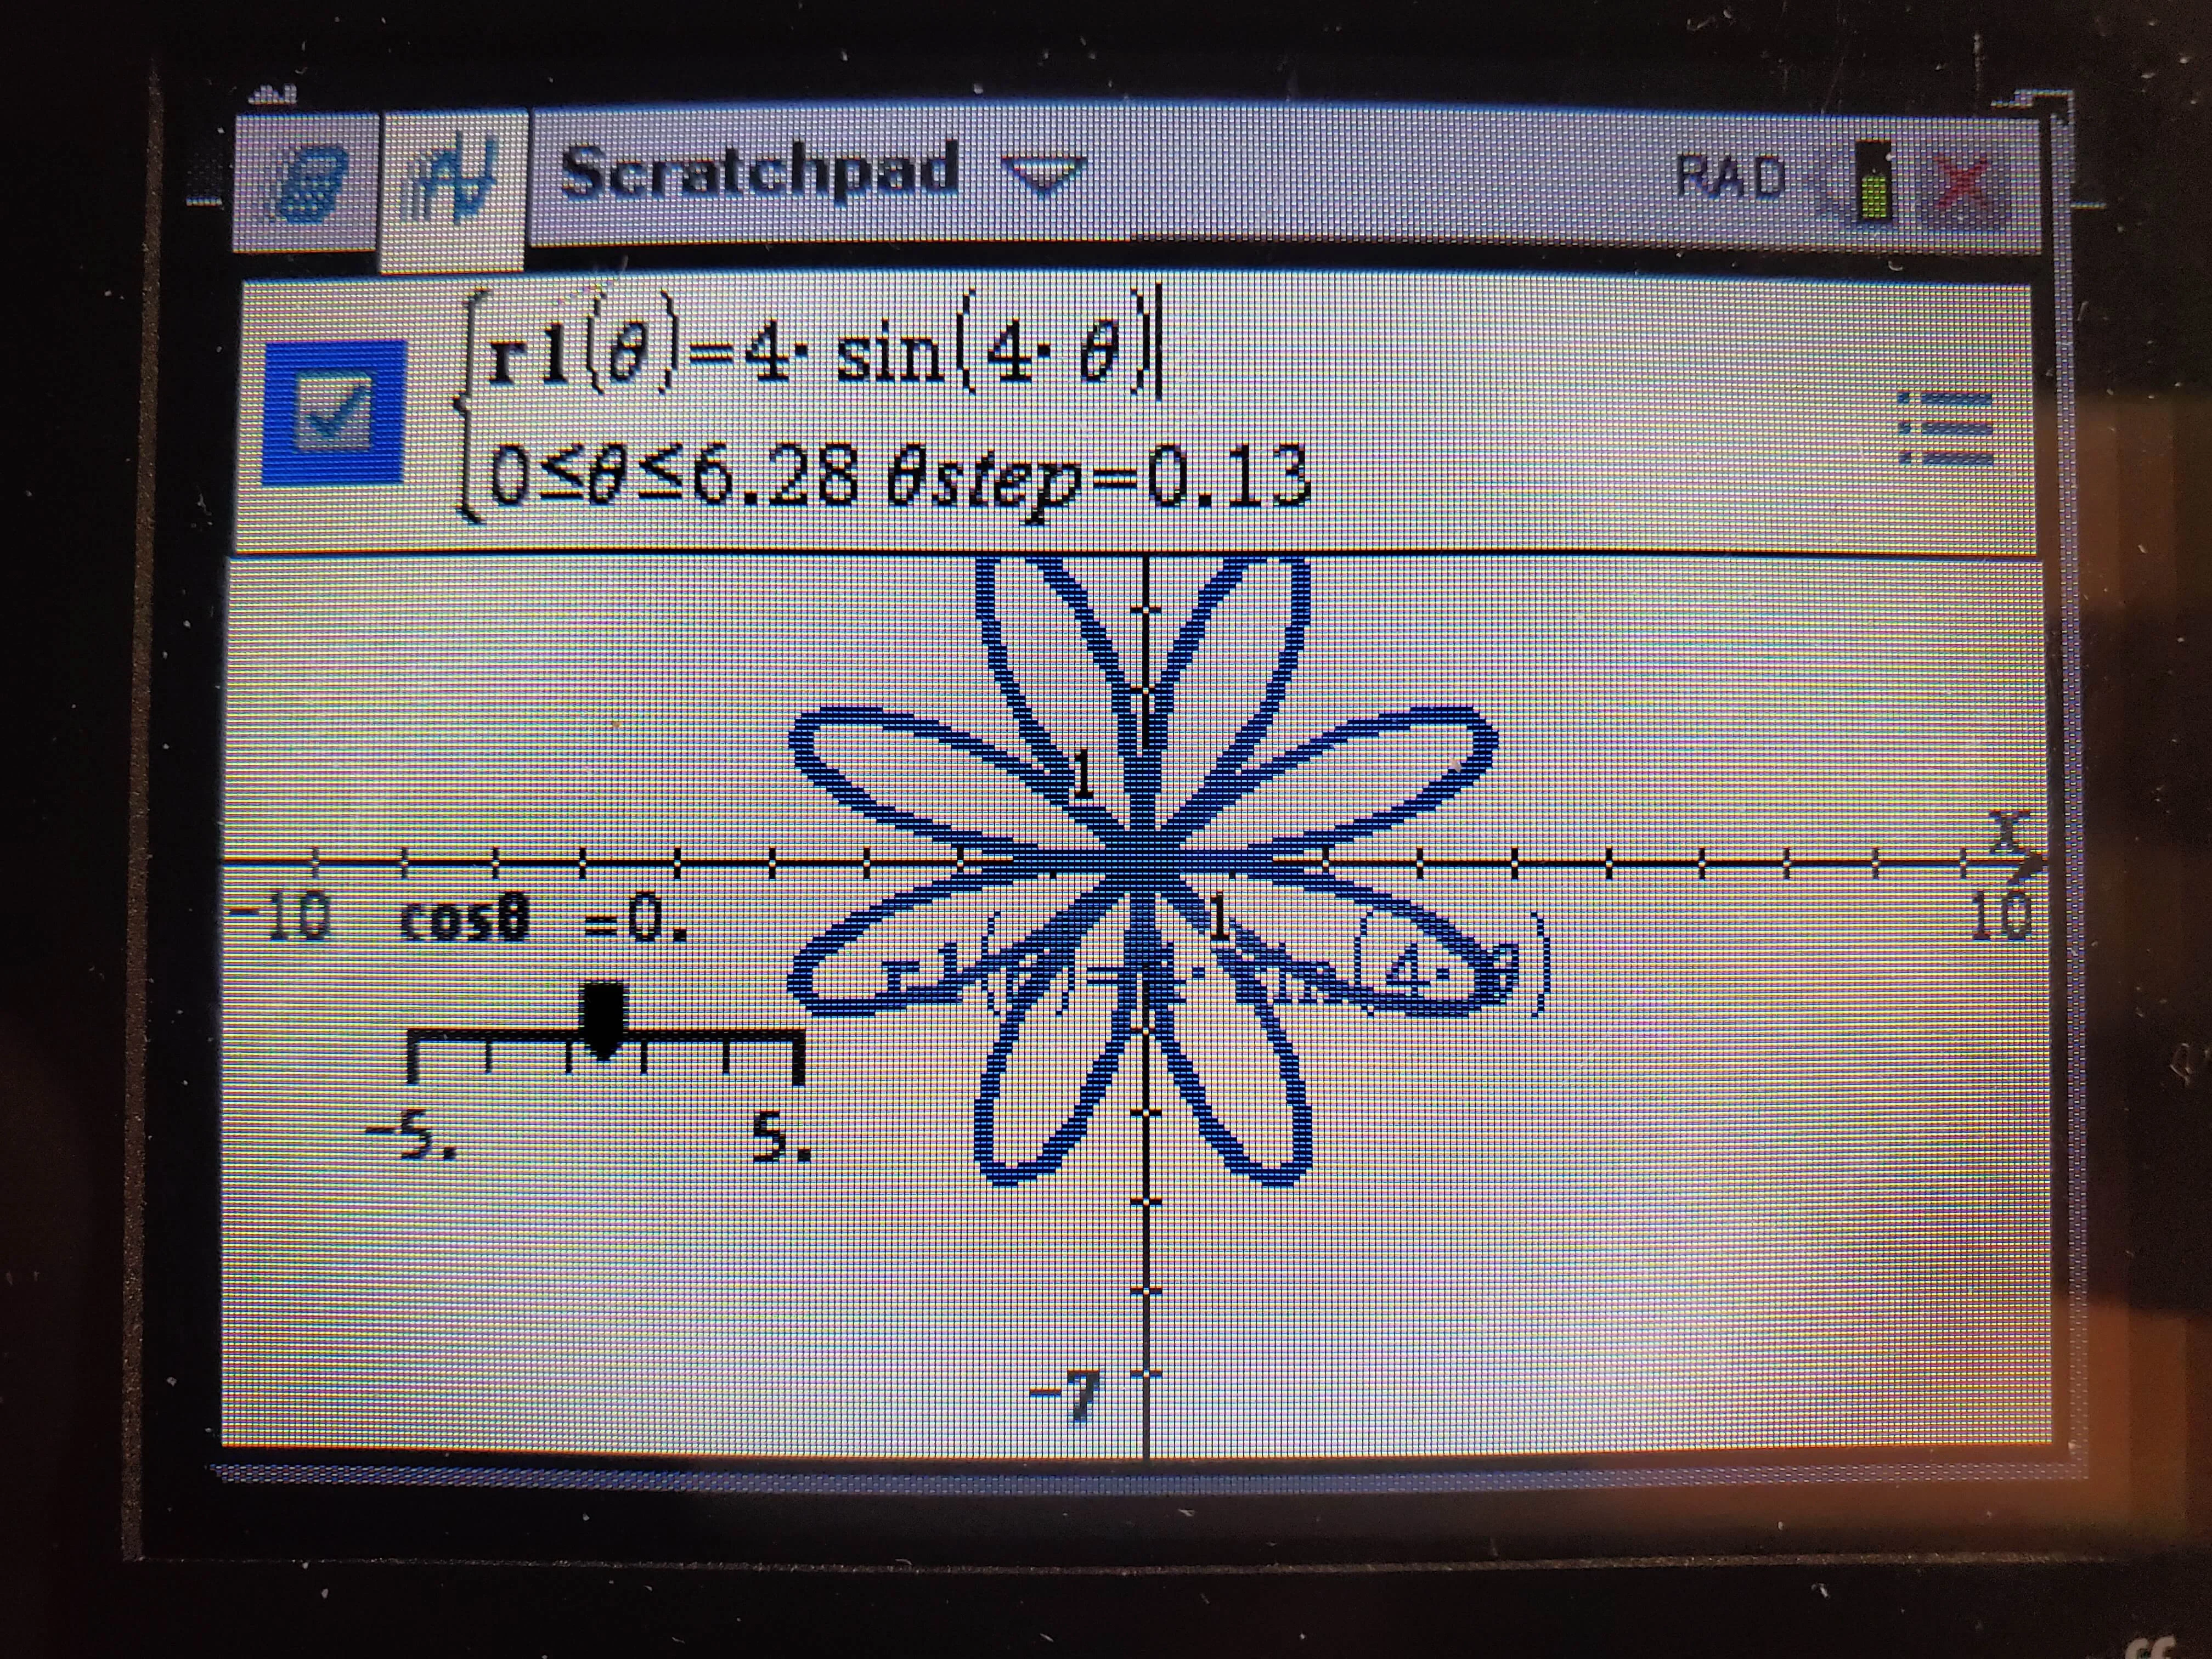
-For even number of b, the blades created are separated(here b=4, so there are 8 “blades”):

-For odd number b, the “blades” are covered with each other, take example of $r=4sin(3θ)$ with [0, 2π], it actually graphed 6 blades, but each two are in the same position covered the another one, so we could only see three. If we do the integral to calculate its area, we get the area of 6 blades.
Thus, if we want to find the area of 3 blades, you can set the interval of [0, π], or just simply divide the area with interval [0, 2π] by two
It’s a very interesting trick dealing with polar equation.
P.S. : hpbsd for me~